Customized telemetry for complete software reliability. Automatically.
Sylogic AI recommends what to measure based on your business priorities. It continuously offers merge-ready fixes for telemetry blind-spots, monitoring your existing repos and observability platforms. Achieve proactive reliability so your teams can build better, faster.

Goodbye observability bloat. Hello context-aware reliability.
Observability bloat is crippling
Collect too much unnecesary dataToo much noise, not enough signalIncidents take too long to resolveEach team has own standards, abilities and maturityObservability tools are expensive and hard to scaleMonths to implement new metrics via laborious, brittle manual processIncomplete or outdated business context within your telemetry
Proactive, business-aware reliability so your teams can focus on building
Collect only telemetry you need Context-rich data for deep insightsResolve incidents fast with complete, aligned telemetryConsistent, policy-driven observability across the orgObservability efficiencyTelemetry stays up to standards as code changesObservability always aligned with current business goals

How it works
Define your needs. Sylogic's AI does the rest.
AI agents can set up observability, add custom instrumentation, keep your telemetry up to standards, resolve issues, and migrate to OpenTelemetry.
Define Your Intent
Use policy templates built on hyperscaler best practices. Tailor with your business context & goals.
1
Suggests SLO Implementation
Converts SLOs into observability configs + code instrumentation.
2
Enhances Existing Observability
Adds consistent and rich business context to your traces.
3
Continuous Learning
Automatically optimize cost + benefits of observability posture.
4
Expand your observability team, without expanding headcount
Error rate > 1% for users in onboarding flow Availability < 99.9% for high-value customers in EuropeJob failure rate > 0.5% for scheduled report generation for paid accountsError rate > 1% for users in onboarding flowAvailability < 99.9% for high-value customers in EuropeJob failure rate > 0.5% for scheduled report generation for paid accounts
Timeouts > 5/min during checkout process for users with cart_value > $500Latency spike > 2x normal for new feature flagged users in A/B test95th percentile query time > 300ms for searches by power usersTimeouts > 5/min during checkout process for users with cart_value > $500Latency spike > 2x normal for new feature flagged users in A/B test95th percentile query time > 300ms for searches by power users
SLO burn rate exceeds threshold for contracts with SLA penalty clausesData sync failures for external integrations used by strategic partnersHigh CPU usage > 85% during batch invoice runs for enterprise accountsSLO burn rate exceeds threshold for contracts with SLA penalty clausesData sync failures for external integrations used by strategic partnersHigh CPU usage > 85% during batch invoice runs for enterprise accounts
Add Hyperscaler expertise to your stack
Our team built observability at scale for the world's most demanding environments. Now, that expertise powers your success.


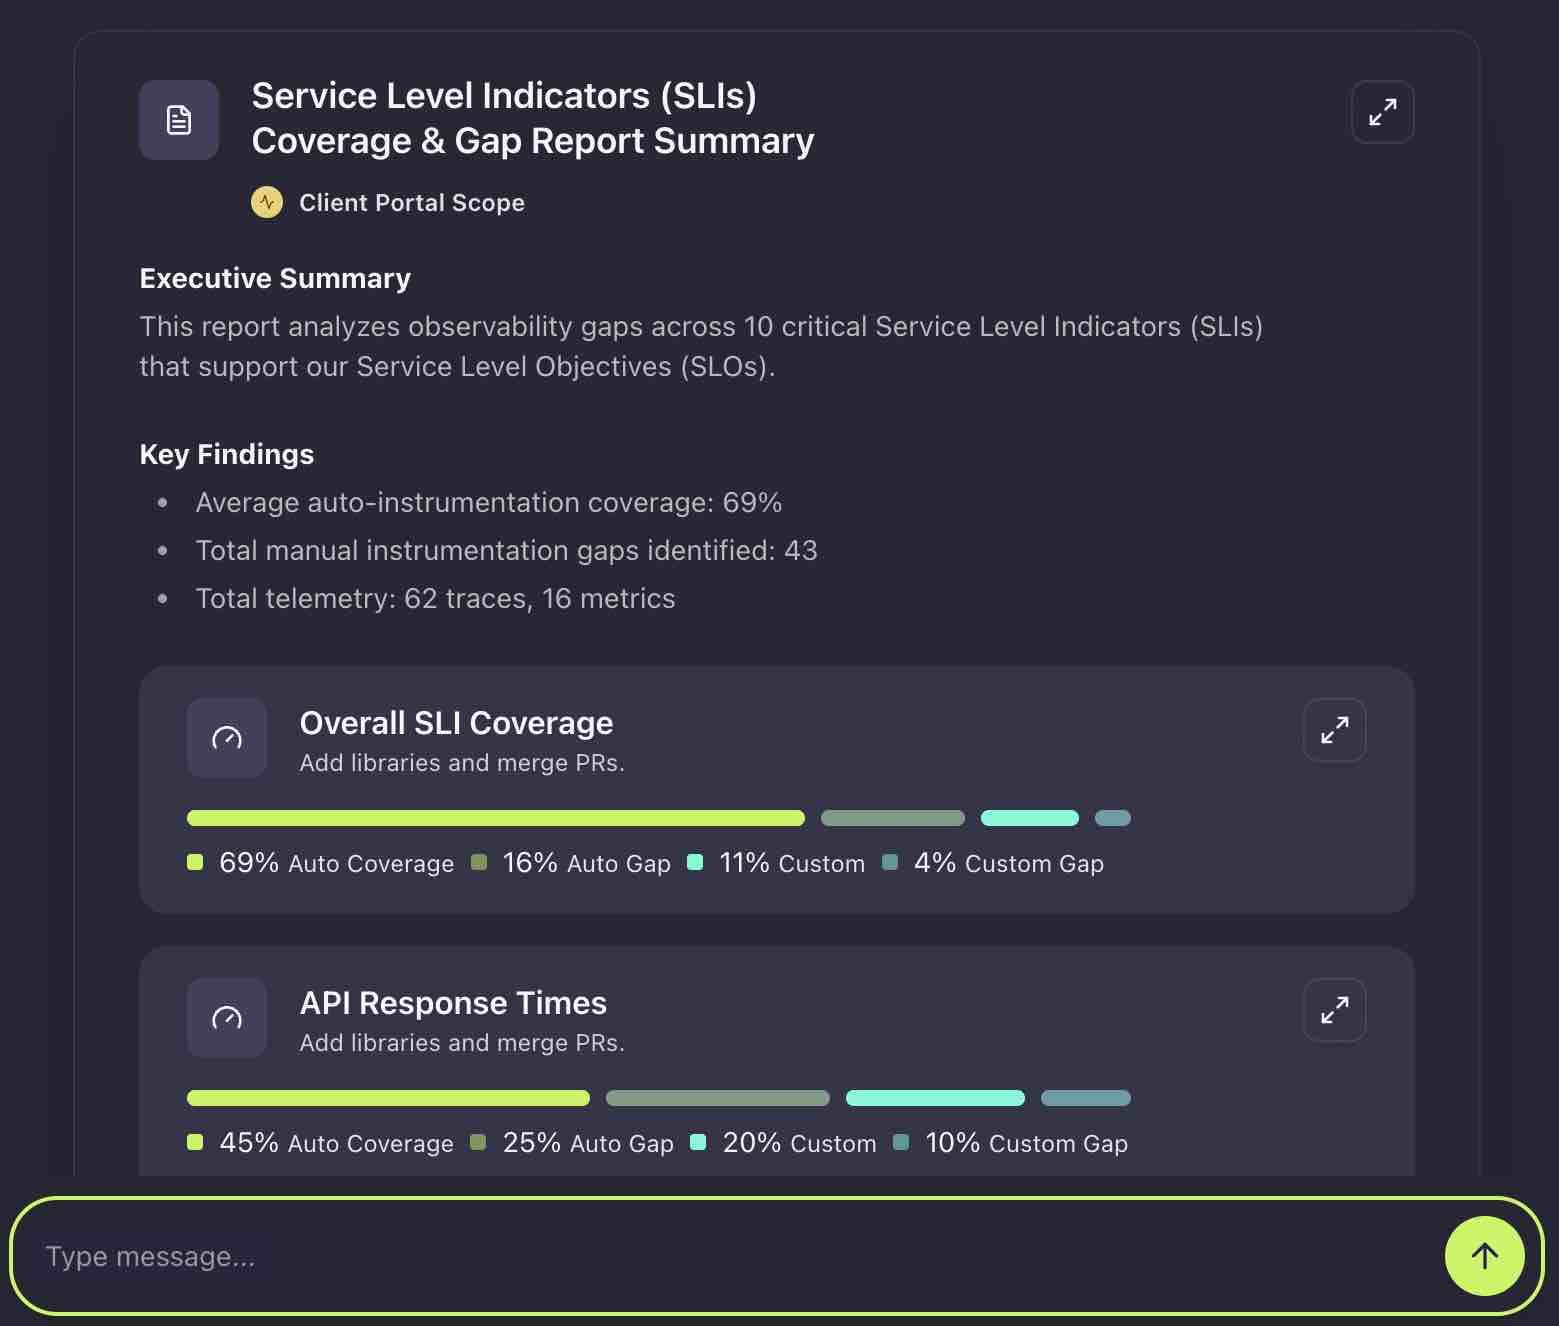
Business-aware telemetry that accelerates product development
Add business-context rich traces in your code. No more grepping infinite logs to find the bug in your micro-services.
Error rate > 1% for users in onboarding flow Availability < 99.9% for high-value customers in EuropeJob failure rate > 0.5% for scheduled report generation for paid accountsError rate > 1% for users in onboarding flowAvailability < 99.9% for high-value customers in EuropeJob failure rate > 0.5% for scheduled report generation for paid accounts
Timeouts > 5/min during checkout process for users with cart_value > $500Latency spike > 2x normal for new feature flagged users in A/B test95th percentile query time > 300ms for searches by power users Timeouts > 5/min during checkout process for users with cart_value > $500Latency spike > 2x normal for new feature flagged users in A/B test95th percentile query time > 300ms for searches by power users
SLO burn rate exceeds threshold for contracts with SLA penalty clausesData sync failures for external integrations used by strategic partnersHigh CPU usage > 85% during batch invoice runs for enterprise accountsSLO burn rate exceeds threshold for contracts with SLA penalty clausesData sync failures for external integrations used by strategic partnersHigh CPU usage > 85% during batch invoice runs for enterprise accounts
Enforce SRE best practices across all your apps
Centralized, SLO-driven automation of the observability posture across your organization. Sylogic detects any config or code changes and immediately recommends adjustments to telemetry to maintain your standards.
Reduce the cost of operating observability
Automate repetitive labor prone to human error. Reduce the "firehose" by collecting just the data you need.
Integrates into your existing stack
Sylogic learns about your context from code repos, tickets, documents and conversations, and interfaces with your observability platform to optimize code instrumentation and data pipelines.
The AI observability landscape
General AI copilots?
AI copilots focus on individuals, not org-wide policy automation
General tools lack Sylogic's deep observability expertise to generate accurate, trustworthy results
Observability vendor AI agents?
Focus is downstream—analyzing messy, incomplete telemetry to help with RCA
Doesn't solve the root problem: consistent, high-value telemetry that gives superpowers to your SREs (human or AI!)
Sylogic AI
Centralized, consistent policy-driven automation across your org
Deep observability expertise
Tackles the root problem—improving telemetry at the source